

|

|
 |
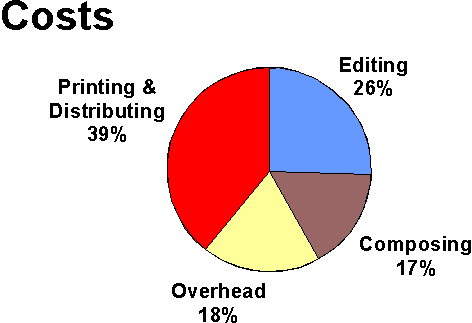
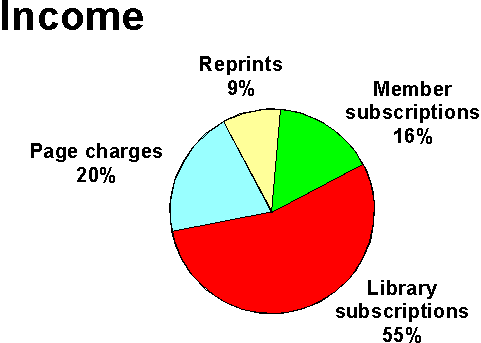
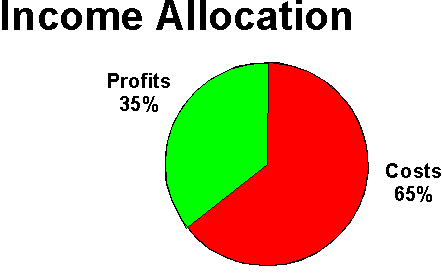
Fig. 3. Fiscal data for a society-published journal. These data
are likely representative of well-edited journals with circulations
of several thousand. (The graphs are based on data for Journal
of Economic Entomology in 1995, when circulation was ca. 3600,
profits were ca. $150,000, and advertising and royalties amounted
to 0.02% of total income.)
[Recent data of this sort are not easy to come by. They surely must vary substantially from publisher to publisher. Two items of special relevance are the proportion of publishing costs spent on production and distribution and the proportion of publishing income that depends on library subscriptions. Here are some other, older data: In 1980?, the American Society for Microbiology budgeted 70, 63, and 66% of its publication costs to “text manufacturing” (CBE 1982, p. 83). In 1980 the American Institute of Physics received 50% of its journal income from non-member subscriptions (CBE 1982, p. 29). In 1977, the production and distribution costs for U. S. environmental and life sciences journals were 39 and 30% of total costs respectively (King 1981, Table 4.26).]